The Missing Link in Concussion Recovery & Return-to-Play: Visual-Motor Deficits

Standard return-to-play protocols operate under a flawed assumption: that if an athlete reports no lingering headaches or brain fog, they are cleared for competition. In elite athletics and tactical environments, this standard fails. Most head injuries disrupt the visual system in ways standard cognitive baselines miss completely. Medical staff routinely clear players when basic symptoms resolve, leaving underlying ocular-motor dysfunction intact.

Athlete performing neurocognitive testing with strobe eyewear and a sensory board at a performance center.

These unseen vision deficits directly impair performance. When an athlete’s eyes cannot converge on a moving target, adjust focus across distances, or track rapid movements, the brain burns massive metabolic energy just trying to parse visual input. Layer on game-film study, complex tactical reads, or high-speed field decisions, and this deficit causes cognitive overload.

Unaddressed visual issues lead to persistent motion sensitivity, headaches, nausea, and anxiety. Because vision is rarely evaluated during standard rehab, these issues get mislabeled as generalized post-concussion syndrome or stress. The result is extended recovery timelines, degraded performance, and a higher risk of secondary injury upon returning to play.

To protect athletes and optimize return-to-play infrastructure, performance directors and medical staff must address visual-motor rehab with the same objective rigor used in musculoskeletal recovery.

The Physiology of Post-Concussive Visual Breakdown

The visual system is an active extension of the central nervous system. Over 50% of neural pathways involve visual processing, direct motor output, and spatial orientation (Master et al., 2016). When impact forces shear axons or trigger a neurometabolic cascade, they disrupt the visual-vestibular network that keeps visual fields stable during movement.

Clinical research shows that up to 82% of post-concussion patients present with measurable ocular-motor dysfunction (Ciuffreda et al., 2017; Master et al., 2016). Visual impairment is not an edge-case symptom; it is the dominant manifestation of central sensory mismatch.

The Three Primary Subsystems

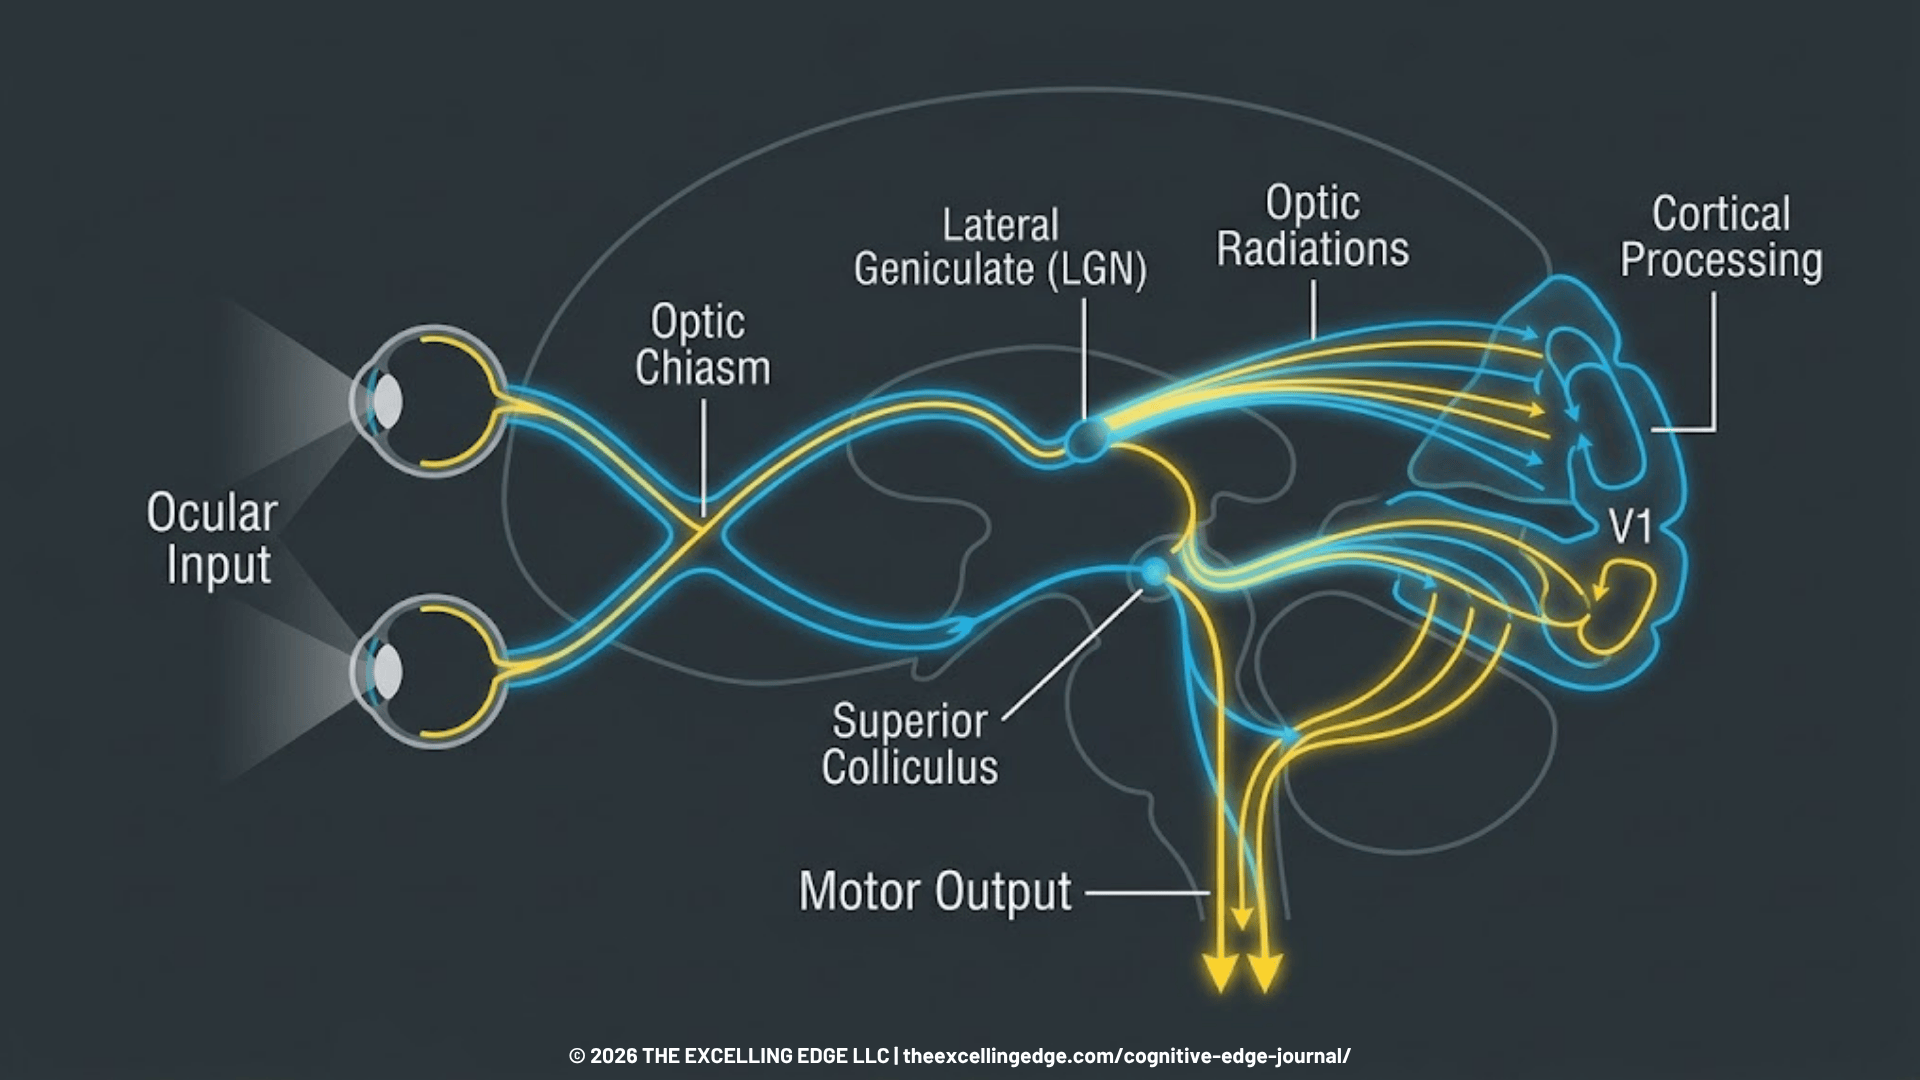
Diagram showing visual-motor neural pathways connecting ocular input to motor output execution.
Figure 1: Disruption in ocular-motor networks forces the brain to expend extra metabolic energy to maintain visual stability.
  1. Visual Convergence: The inward rotation of both eyes to maintain single focus on a near object, controlled by Cranial Nerve III. Post-concussion, convergence insufficiency occurs in up to 55% of cases. One eye drifts outward under fatigue, causing blurred or double vision and disrupting depth perception.
  2. Accommodation: The eye’s ability to adjust lens focus across distances. Accommodative breakdown, identified in up to 65% of concussive injuries, prevents an athlete from rapidly switching focus from a far target (surveying the field) to a near target (tracking a ball into their hands).
  3. Saccadic Eye Movements: Fast, precise eye movements that switch fixation between targets. Saccades rely on the frontal eye fields, superior colliculus, and brainstem (Mucha et al., 2014). Trauma causes saccadic dysmetria—overshooting or undershooting visual targets—which slows overall processing speed.

The Metabolic Cost of Visual Dysfunction

When these subsystems fail, the brain receives conflicting signals from the eyes and inner ear. To compensate, the brain reallocates processing power simply to keep the visual environment stable. This constant correction drains central nervous system reserves, explaining why concussed athletes experience sudden fatigue or headaches when reading, analyzing film, or navigating crowded venues (Kontos et al., 2017).

Lab Notes: The Hidden Metabolic Drain

Misaligned ocular-motor systems force the brain to treat visual blur (retinal slip) as a constant error. The continuous neurological effort to correct this error causes rapid central nervous system fatigue, triggering headaches and dizziness during basic visual tasks.

High-Stakes Application: UFC Return-to-Sport Case Analysis

At our Neuro Performance Center in Surprise, AZ, we evaluate athletes, tactical operators, and active aging clients who have dealt with lingering post-concussion symptoms for months or years after an injury.

We were called in to assist with the return-to-sport protocol for an active UFC fighter. His physical therapist worked to bring his resting symptoms back to baseline. However, whenever under physiological activation, he experienced subtle spatial disorientation and timing delays that left him open to counter-strikes. Traditional concussion batteries marked him as fully recovered, but his functional tracking told a different story.

Using digital diagnostics and sensory station technology, we evaluated his ocular systems under movement. We identified an isolated visual field deficit and a clear delay in neuro-motor reaction time. His saccadic latency—the time required to spot a strike and initiate a visual response—was significantly degraded.

Clearing him based on symptom reports alone would have placed him at extreme risk for a secondary head injury. We built a visual-motor integration protocol alongside his PT, combining strobe eyewear with real-time heart-rate tracking to match the conditioning demands of a fight. By restricting visual information while pushing cardiovascular load, we trained his visual cortex to process sparse data faster.

Within weeks, re-testing showed complete recovery of his saccadic speed and visual-motor integration. He returned to sparing and competing with full spatial awareness, quicker visual processing and reaction speed.

The Return-to-Play Framework: The Four-Phase Visual-Motor Protocol

Visual-motor deficits are both measurable and trainable. You can integrate this four-phase framework directly into existing rehabilitation pipelines.

Phase 1: Objective Baselines and VOMS Screening

Establish an objective baseline using the Vestibular/Ocular Motor Screening (VOMS) alongside standard cognitive baselines like ImPACT.

  • Action: Test smooth pursuit, horizontal and vertical saccades, Near Point of Convergence (NPC), and the Vestibulo-Ocular Reflex (VOR).
  • Metric: A normal NPC is under 5 cm. Any distance beyond 5 cm, or any symptom provocation (nausea, dizziness, eye strain) during saccades, signals functional visual disruption.

Phase 2: Ocular-Motor Isolation

Isolate and retrain the cranial nerve pathways responsible for convergence and tracking once resting symptoms are stable.

  • Action (Brock String Drills): Use a 10-foot Brock String with multi-colored beads to train convergence and binocular alignment.
  • Execution: Have the athlete focus on the nearest bead, confirming both eyes align on it (forming a clean visual ‘X’), then rapidly shift focus to middle and far beads. Hold focus for 3 seconds per target to rebuild ciliary muscle control.

Phase 3: Visual-Motor Integration & Cognitive Loading

Evaluating cognitive-motor function in isolation creates false positives. Studies show that athletes cleared by standard static baselines still experience degraded reaction times and visual-motor breakdowns under dual-task condition loading—elevating secondary injury and concussion risk by up to 300% upon return to play (Brooks et al., 2016).

  • Action (Strobe Eyewear Protocol): Introduce stroboscopic glasses during footwork, catching drills, or tactical movements to simulate field conditions.
  • Execution: Perform dynamic movement and sport-specific while the eyewear alternates between clear and opaque states. Removing milliseconds of visual feedback forces the nervous system to predict target trajectories and process visual input faster under cognitive load.

Phase 4: Autonomic Stress Integration

Re-evaluate visual processing under high heart rate conditions. Visual deficits frequently re-emerge when the sympathetic nervous system is engaged (Howell et al., 2013). Active, sub-symptom threshold aerobic exercise is proven to speed recovery by restoring autonomic nervous system control and normalizing cerebral blood flow.

  • Action: Combine high-intensity cardiovascular efforts (e.g., Assault Bike sprints) with dynamic target tracking or call-out visual charts or light targets.
  • Metric: Clear the athlete only when visual processing speed and accuracy match baseline levels under maximum cardiovascular exertion.

Lab Notes: Multi-Disciplinary Standard

Vision training does not replace physical therapy; it completes it. Effective return-to-play requires physical therapists, athletic trainers, and neuro-performance staff working from the same objective dataset.

Ensure Complete Competitive Readiness

Relying on subjective symptom checklists and basic pen-and-paper baselines leaves performance on the table and puts athletes at risk. If your return-to-play pipeline does not measure and train visual-motor processing—under physiological and cognitive load, your clearance protocol is incomplete.

Book a 15-Minute Neuro-Tech Audit Call to review your organization’s RTP process and ensure the long-term health and safety of your athletes and operators.

References

The Plasticity of Longevity: Rewiring the Aging Brain for Peak Executive Output

As a top performing executive, you operate in an environment where peak cognitive performance—your information processing, working memory, and mental agility—is your greatest asset. However, a significant blind spot exists in current executive health optimization. While you likely track your cardiovascular, metabolic, and physical metrics with precision, cognitive stamina is often relegated to a static baseline, an assumption that fails to account for the reality of neurological aging. Treating your brain as a fixed constant rather than a dynamic, trainable system is a strategy that leaves your most important competitive advantage at risk.

Executive undergoing visual-cognitive evaluation with stroboscopic eyewear at Neuro Performance Center in Surprise AZ.

When cognitive fatigue inevitably degrades prefrontal processing speed, standard practice relies on central nervous system stimulants or pharmaceutical sleep aids. These interventions mask neurological taxing and exhaustion without addressing the underlying structural degradation of prefrontal cortical networks.

Infographic showing the executive cognitive gap between physical fitness training and unaddressed prefrontal cortical degradation.
Figure 1: Treating cognitive stamina as a static baseline leads to reactive stimulant use rather than targeted neuroplastic adaptation.

The prefrontal cortex (PFC) exhibits earlier and steeper age-related structural decline than motor or primary sensory cortices. Reductions in gray matter volume, synaptic density, and microvascular perfusion directly impair the neural networks responsible for top-down executive control (Raz et al., 2005).

Treating cognitive fatigue as a chemical deficiency rather than a neuroplastic conditioning gap results in accelerated burnout and compromised long-term cognitive reserve. 

Preserving decision-making speed and establishing resistance to cognitive decline requires combining progressive cognitive loading with real-time autonomic nervous system regulation. Physical conditioning alone cannot shield prefrontal processing networks from degradation; targeted neurocognitive training is necessary to maintain neural plasticity across an aging executive brain.

The Science of Aging and Executive Performance

Let’s look at the neuroscience that drives executive functioning in your brain. Executive function depends on the structural integrity of the dorsolateral prefrontal cortex (dlPFC) and the anterior cingulate cortex (ACC). These structures execute working memory management, impulse inhibition, and strategic attentional allocation. Beginning in the fourth decade of life, the PFC undergoes structural shifts: dendritic spines retract, synaptic connections thin, and localized microvascular perfusion decreases (Arnsten, 2009).

Simultaneously, the locus coeruleus-norepinephrine (LC-NE) system and mesocortical dopaminergic projections experience age-related reductions in receptor sensitivity and neurotransmitter synthesis. Optimal catecholamine levels (dopamine and norepinephrine) must bind to high-affinity alpha-2A adrenoceptors and D1 receptors in the dlPFC to sustain persistent neural firing during complex cognitive operations (Arnsten, 2009).

When stress or aging disrupts catecholamine equilibrium, prefrontal microcircuits experience a reduced signal-to-noise ratio. This degradation manifests clinically as increased distractibility, information processing delays, and reduced mental flexibility under stress.

Diagram illustrating structural and neurochemical shifts in the aging prefrontal cortex under stress.
Figure 2: Structural atrophy and catecholaminergic decline converge to reduce prefrontal signal-to-noise ratio and increase executive latency.

Sensory-Motor Integration and Visual-Vestibular Processing

Cognitive speed relies directly on oculomotor control and visual integration. Over 50% of the human cerebral cortex engages in visual processing, gaze stabilization, and spatial orientation. The visual-vestibular-autonomic loop operates as the primary sensory gate for executive execution:

$$\text{Retinal Input} \longrightarrow \text{Superior Colliculus} \longrightarrow \text{Frontal Eye Fields (FEF)} \longrightarrow \text{dlPFC}$$

Poor sensory input corrupts strategic decision making and performance. Age-related delays in saccadic accuracy, visual pursuit alignment, and contrast sensitivity degrade the inputs fed into the prefrontal cortex. When visual processing efficiency slows, the PFC must redirect valuable attentional bandwidth to basic spatial stabilization, reducing the metabolic energy available for high-level reasoning and risk assessment (Park & Reuter-Lorenz, 2009).

Cognitive Reserve and the Scaffolding Theory of Aging (STAC-r)

Building long-term neurological resilience requires expanding cognitive reserve—the brain’s capacity to optimize performance through alternate neural pathways when primary networks face structural strain. Under the Scaffolding Theory of Aging and Cognition (STAC-r), the brain adapts to biological changes by recruiting compensatory neural scaffolding (Park & Reuter-Lorenz, 2009).

Lab Note: Prefrontal Resource Allocation

High-performance execution requires minimizing the metabolic cost of spatial orientation. When visual-vestibular processing slows, the prefrontal cortex expends excess metabolic resources on basic environmental tracking, compromising the bandwidth needed for executive decisions under operational stress.

Targeted, non-repetitive cognitive-motor challenges stimulate this scaffolding. Subjecting the nervous system to visual-cognitive tasks while managing physical or autonomic strain triggers Activity-Dependent Synaptogenesis and systemic expression of Brain-Derived Neurotrophic Factor (BDNF) (Erickson et al., 2011). This biological cascade strengthens prefrontal networks, preserving processing speed and decision accuracy throughout the lifespan.

This doesn’t just improve short-term performance, but strengthens executive networks that support long-term cognitive capability and healthspan. 

Real-World Evidence: Quantifying Executive Performance Gains

At the Neuro Performance Center in Surprise, Arizona, we evaluate tactical operators, elite athletes, and executive leaders using closed-loop diagnostic protocols. Rather than separating physical capacity from mental output, our diagnostic battery measures visual-motor integration, executive processing speed, dynamic oculomotor control, and autonomic balance under high cognitive load.

Longitudinal Diagnostic Case Data (2-Year Tracking)

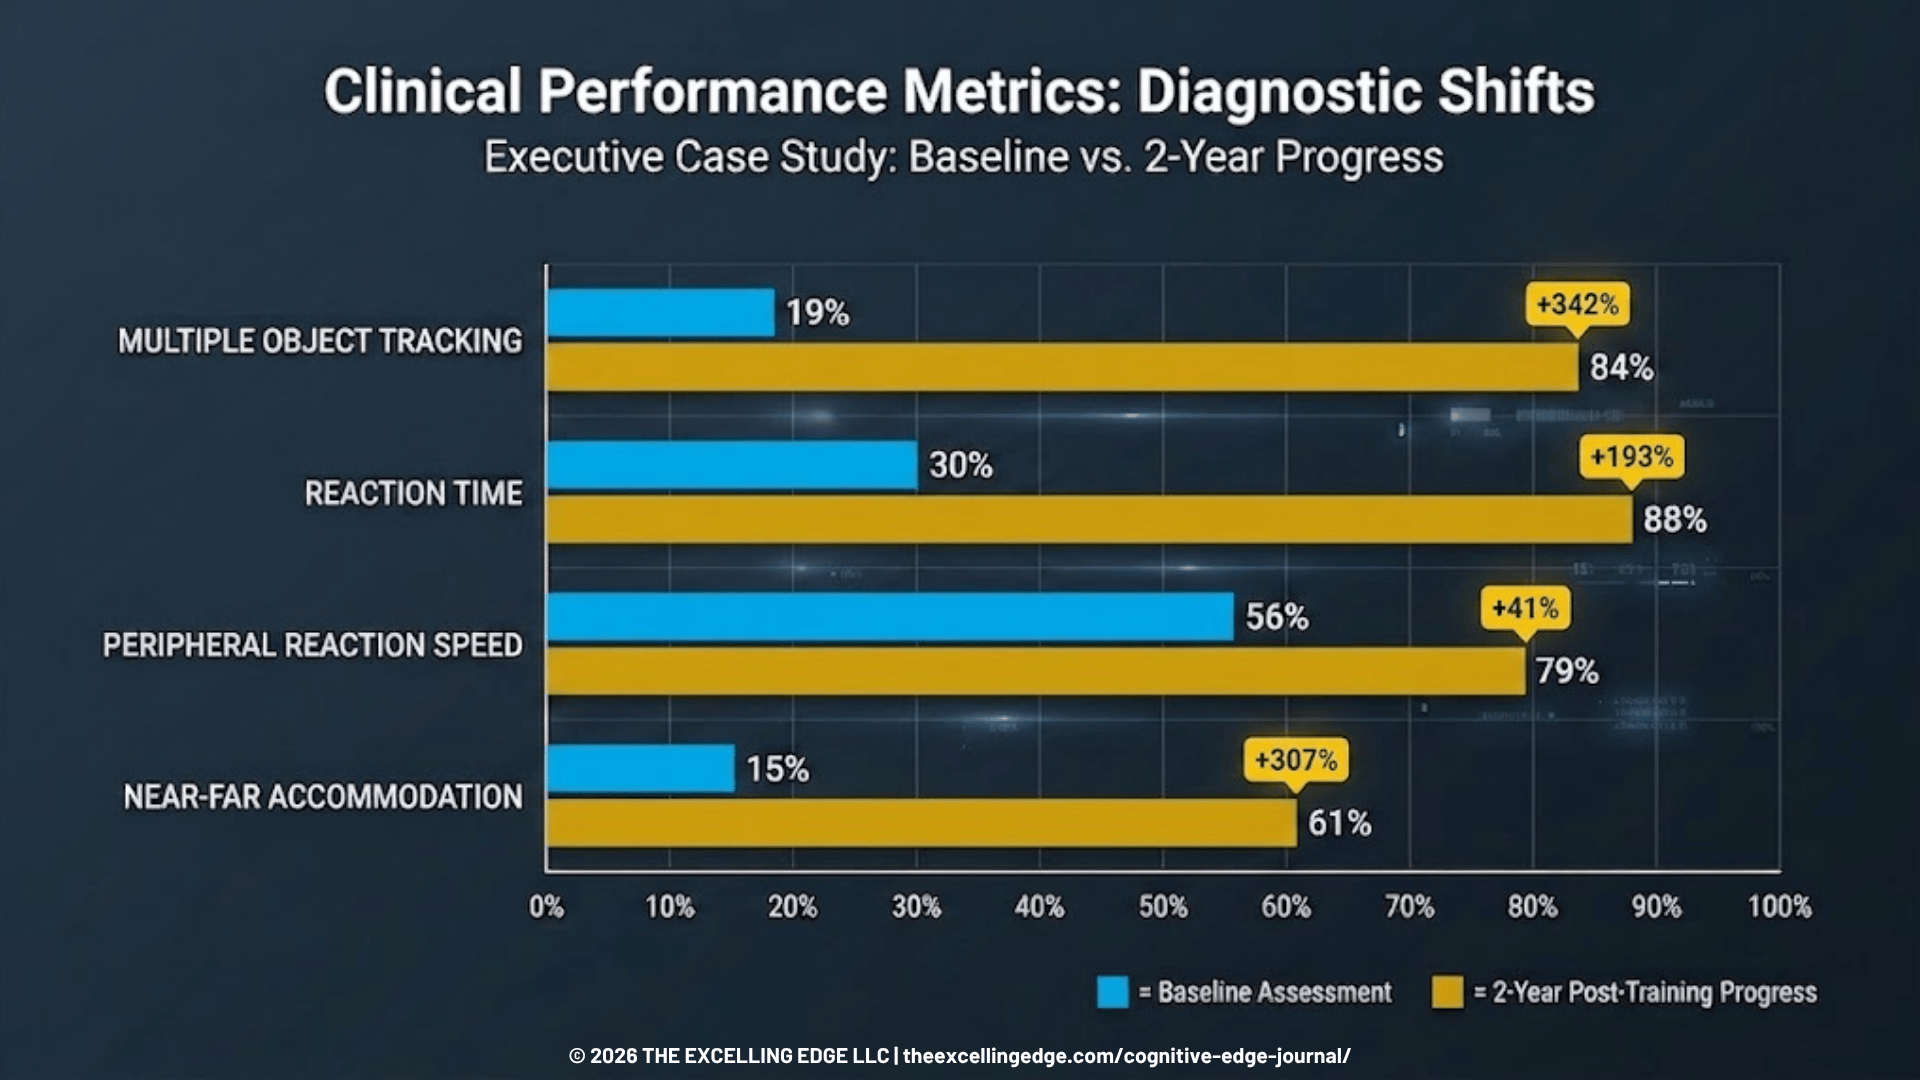
To quantify the impact of systematic neurocognitive loading combined with autonomic regulation, we tracked an executive client at our Surprise, AZ center over a two-year period (December 2023 through February 2025). Diagnostics were collected on the Senaptec Sensory Station to establish percentile rankings against a normative database of elite performers.

Figure 3: Diagnostic evaluation data from the Neuro Performance Center in Surprise, AZ, tracking client percentile gains over 24 months.

Diagnostic Shifts & Clinical Analysis:

  1. Multiple Object Tracking (MOT) & Dynamic Attention: In December 2023, the client scored in the 19th percentile for MOT, indicating compromised spatial tracking and attentional resources under load. Following dual-task training incorporating stroboscopic occlusion and dynamic target identification, performance reached the 84th percentile by February 2025.
  2. Reaction Time & Neural Efficiency: Initial assessments measured total reaction time in the 30th percentile. By February 2025, total reaction speed reached the 88th percentile (346 ms overall latency; 366 ms dominant, 325 ms non-dominant), reflecting increased transmission velocity along corticospinal pathways.
  3. Peripheral Processing & Oculomotor Control: Peripheral reaction speed advanced from the 56th to the 79th percentile (751 ms response latency), while Near-Far Quickness moved from the 15th to the 61st percentile. Contrast sensitivity demonstrated a parallel shift from the 5th to the 34th percentile.

These longitudinal metrics confirm that prefrontal processing networks remain highly plastic in mature adults. Systematically overloading the visual-spatial processing loop while regulating autonomic stress restores processing latency and expands functional cognitive reserve.

Lab Note: Autonomic Balance and Visual Capture

Maintaining high heart rate variability (HRV) under cognitive strain stabilizes prefrontal regulation. When sympathetic arousal overwhelms parasympathetic braking, visual search patterns become chaotic, increasing processing delays and errors in decision-making.

Operationalizing Neuro-Longevity: Your Daily Protocol

Translating these principles into daily routines requires protocols that combine autonomic control, oculomotor conditioning, and dual-task cognitive loading. This structured protocol strengthens prefrontal processing stamina and reinforces cognitive reserve.

[image 4 – protocol]

Phase 1: Autonomic Down-Regulation (Resonant Breathing) – Readiness

  • Objective: Establish vagal tone and balance catecholamine release prior to high cognitive loads.
  • Execution: Perform 5 minutes of resonant frequency breathing at 6 breaths per minute (4-second inhale, 6-second exhale) using real-time HRV biofeedback.
  • Mechanism: Resonant breathing amplifies Respiratory Sinus Arrhythmia (RSA), increasing vagal afferent signals to the nucleus tractus solitarius and stabilizing prefrontal circuits against stress-induced performance drops (Arnsten, 2009).

Phase 2: Dynamic Visual-Oculomotor Saccades – Priming

  • Objective: Drive regional blood flow to the Frontal Eye Fields (FEF) and associated prefrontal networks.
  • Execution: Position two visual targets 6 feet apart on a wall. Keeping the torso stationary, perform rapid, precise saccadic eye movements between targets for 60 seconds. Transition immediately to 60 seconds of smooth pursuit tracking (moving a target in a figure-eight pattern at arm’s length while maintaining continuous central visual focus).
  • Mechanism: Activates cranial nerves III, IV, and VI while stimulating frontoparietal attentional networks, raising baseline cortical readiness without elevating systemic stress hormones.

Phase 3: Dual-Task Cognitive Overload Protocol – Training

  • Objective: Induce cognitive-motor interference to stimulate synaptogenesis and expand cognitive reserve.
  • Execution: Combine a physical balance or movement challenge (e.g., single-leg stance on an unstable surface or multi-directional footwork) with working memory tasks (e.g., auditory 2-back tests or serial subtractions by 7s). Progress over time to introduce stroboscopic eyewear or dynamic target changes to increase visual processing demand.
  • Frequency: 10 to 15 minutes per session, 3 to 4 days per week.

Vector graphic detailing the dual-task cognitive loading protocol for brain plasticity and BDNF expression.
Figure 4: Combining motor tasks, cognitive load, and visual occlusion drives synaptogenesis and prefrontal scaffolding.

Cognitive resilience demands proactive conditioning. Don’t wait for noticeable slippage or symptoms to show up. To evaluate your baseline processing speed, visual-motor performance, and autonomic stress resilience, schedule an assessment with our expert human performance team.

Schedule Your In-Center Assessment at our Surprise, AZ Neuro Performance Center

References

In-Game Tunnel Vision: Expanding Peripheral Awareness Under High-Metabolic Stress

Elite performance frequently breaks down in late-game situations and it follows predictable patterns. A quarterback throws into double coverage on a weak-side zone drop; a midfielder misses an overlapping defender during extra time; a tactical operator fails to detect a lateral threat during an urban room-clearing exercise.

Elite athlete wearing liquid crystal strobe eyewear during visual performance testing at Neuro Performance Center in Surprise AZ.

In post-game film sessions, coaches routinely categorize these errors as “mental mistakes,” “lack of discipline,” or “tactical fatigue.”

However, this diagnosis fundamentally misidentifies the underlying biological breakdown.

Standard athletic vision evaluations assess static visual acuity in low-arousal environments. Clinicians measure Snellen fractions (20/20 vision), static visual fields, and smooth pursuit eye movements while the athlete sits comfortably in a quiet room. However, elite athletic competition never occurs in a low-arousal, static state.

As physical exertion pushes heart rates past the anaerobic threshold ($HR > 85\% HR_{max}$) and catecholamine levels surge, the central nervous system undergoes acute sensory prioritization. The brain shifts focus inward, causing the peripheral visual field to collapse – a phenomenon known as stress-induced foveal tunnel vision.

The operational gap in elite sports is stark: organizations test static visual acuity at rest, yet demand dynamic spatial processing under extreme physiological stress. Perceptual failures in high-stakes competition are rarely motivational or tactical; they are neuro-visual processing bottlenecks caused by unmanaged autonomic arousal.

The Retino-Cortical Shift: Why Stress Hijacks Visual Processing

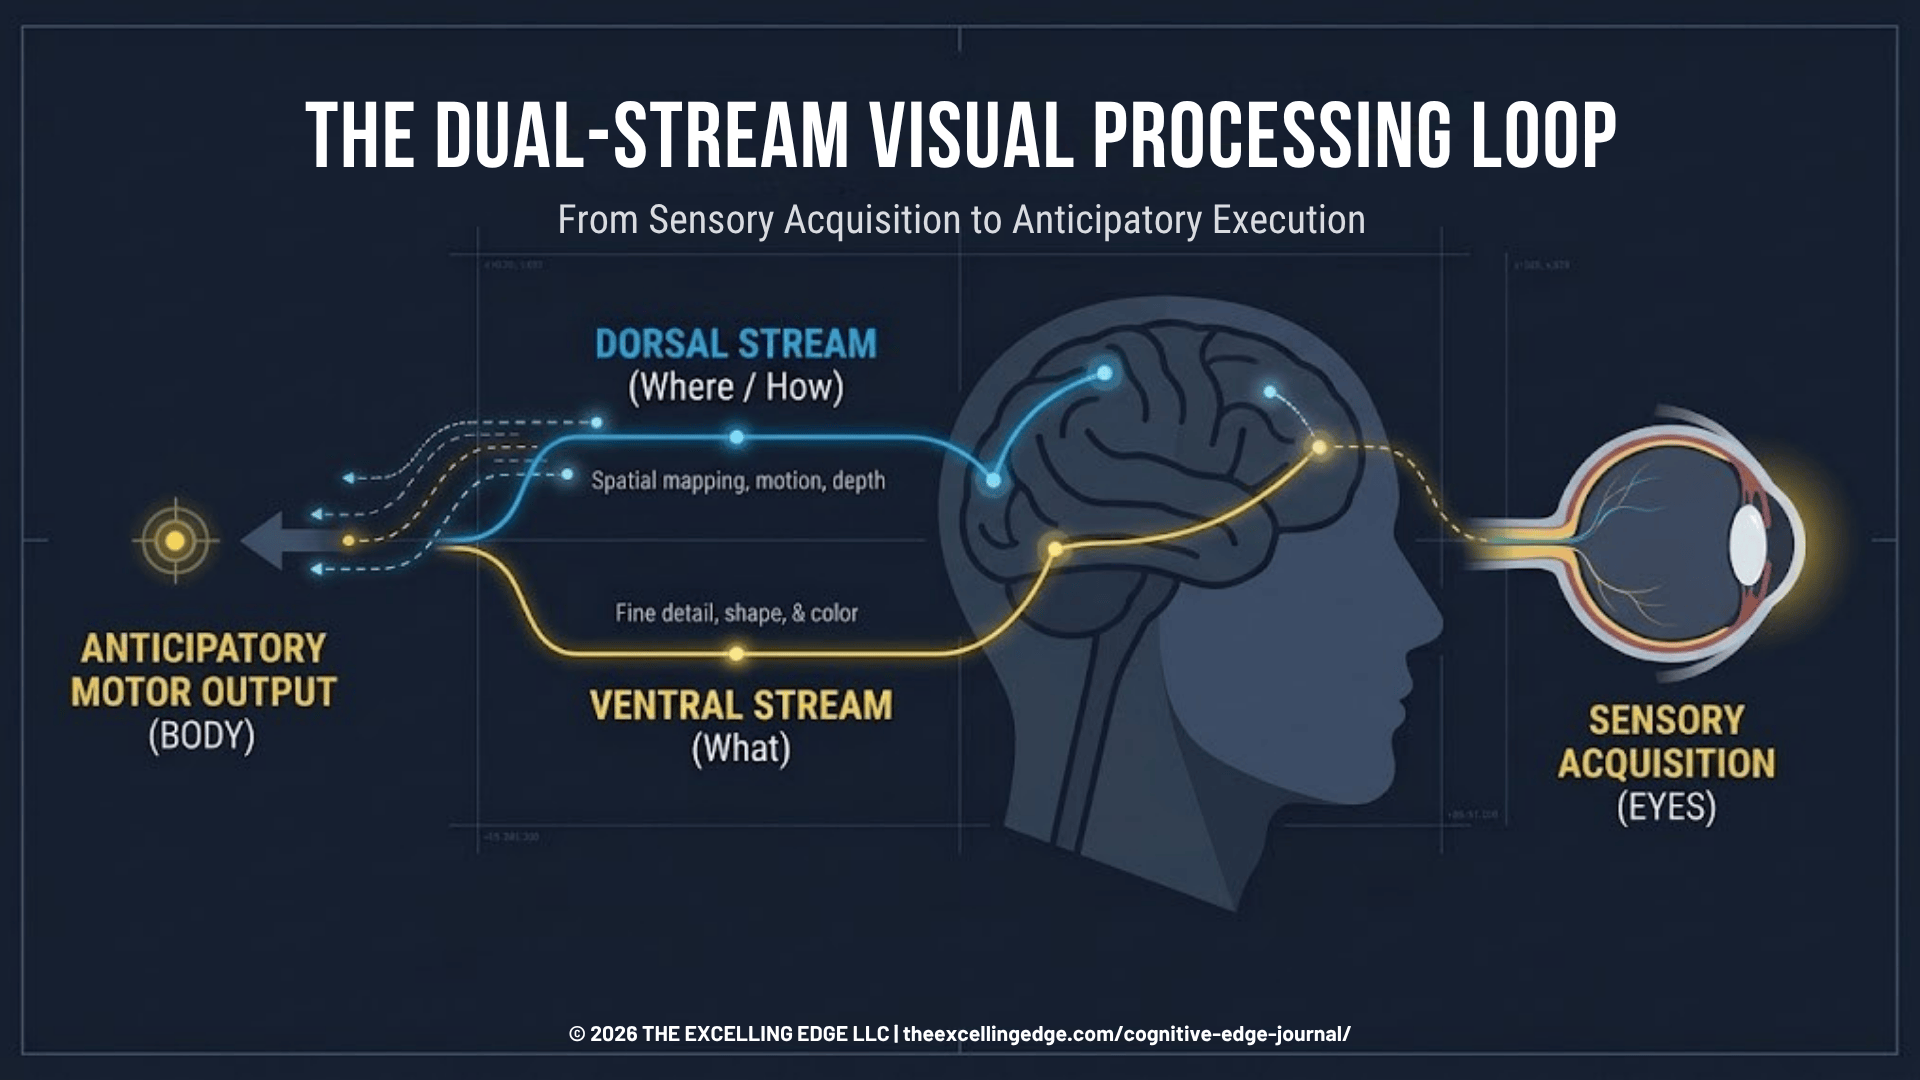
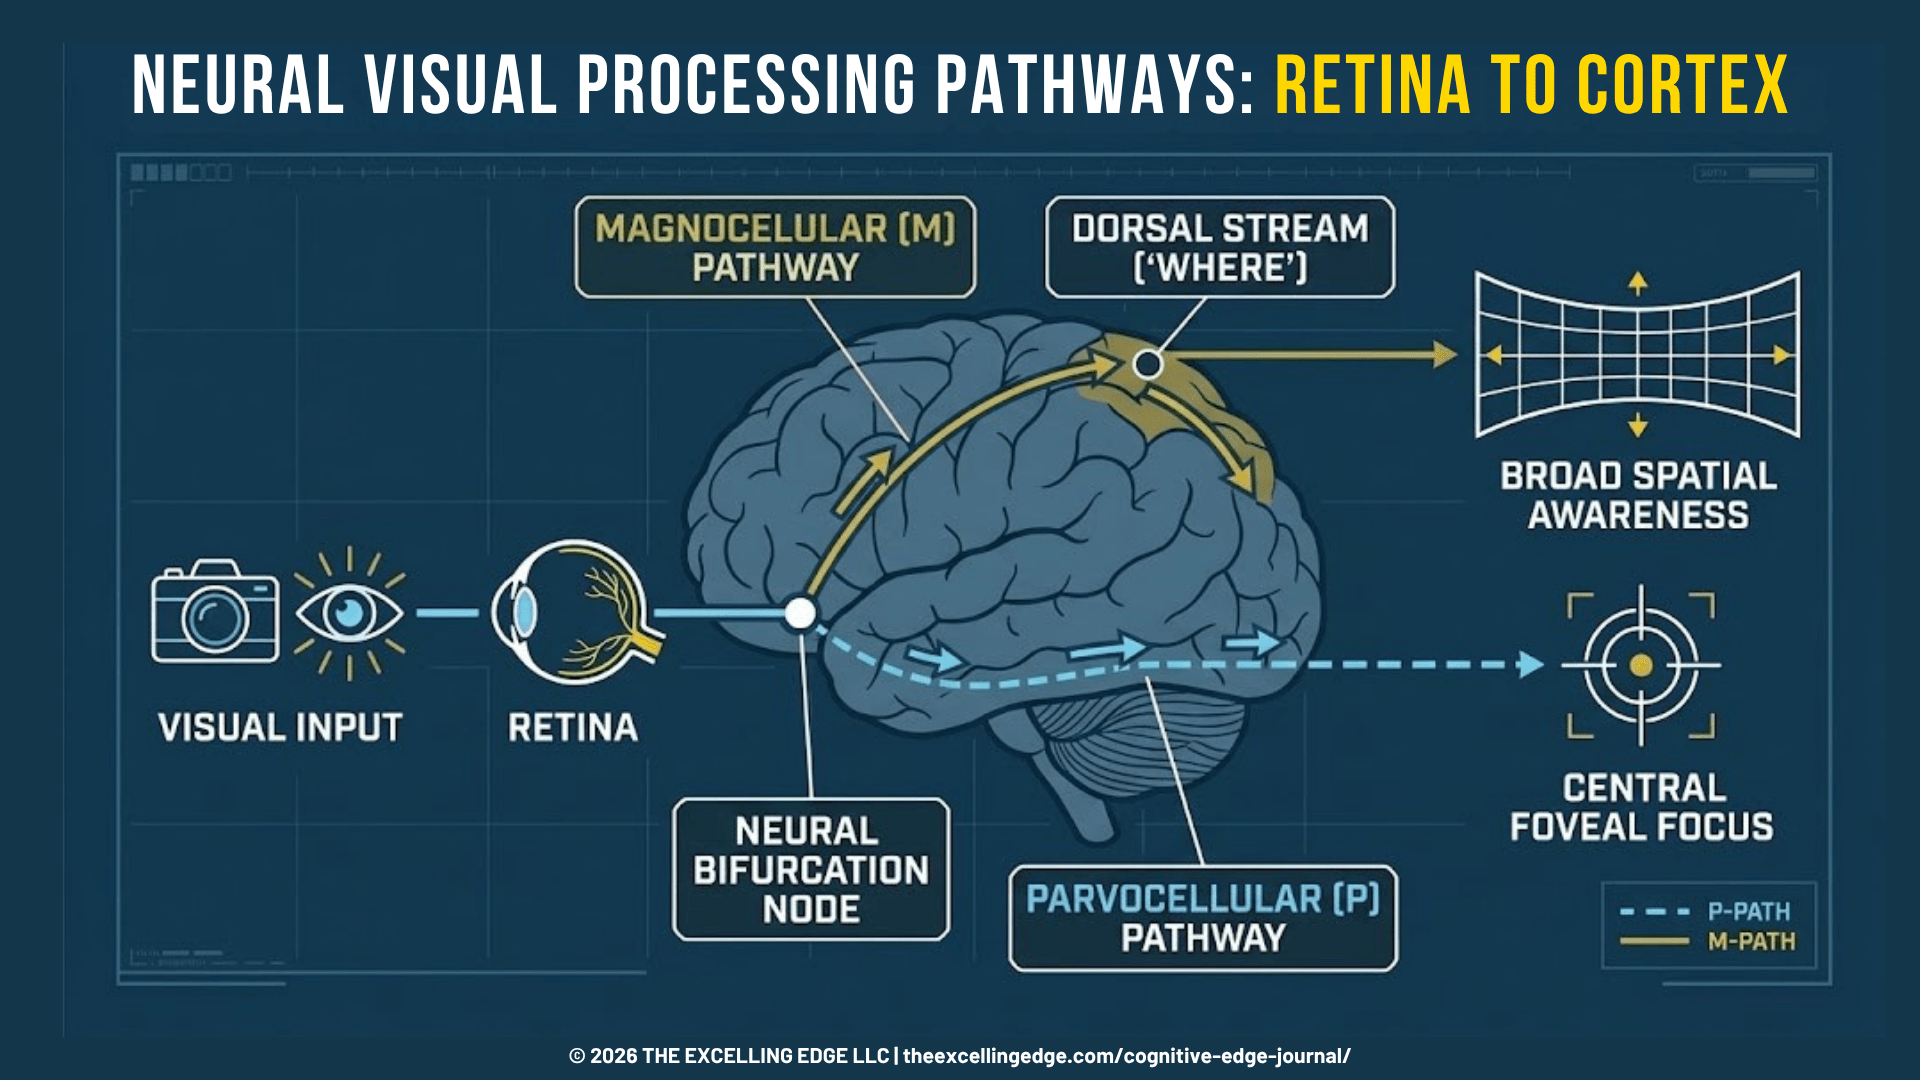
To solve visual collapse under stress, we must analyze the visual processing architecture of the human primate brain, specifically the separation between two distinct retino-cortical pathways: the Parvocellular (P) pathway and the Magnocellular (M) pathway.

Diagram illustrating dual visual processing streams (Magnocellular Dorsal vs. Parvocellular Ventral) and visual field changes comparing resting state (broad field) to high metabolic stress state (tunnel vision)
Figure 1: Elevated catecholamine levels and high heart rates suppress the magnocellular (dorsal) pathway, collapsing functional peripheral awareness into a narrow central foveal cone while parvocellular focus remains preserved.

1. Parvocellular (P) Pathway — Ventral Stream (“What”)

  • Anatomical Origin: Begins with P-type retinal ganglion cells and projects to the parvocellular layers of the Lateral Geniculate Nucleus (LGN), terminating in the primary visual cortex (V1) before feeding the ventral visual stream (inferior temporal cortex).
  • Functional Role: Responsible for high spatial frequency, fine detail, color perception, and central foveal fixation.
  • Temporal Characteristics: Slow processing speed (>100 ms processing delay); visual input must be stationary or moving slowly for accurate resolution.

2. Magnocellular (M) Pathway — Dorsal Stream (“Where / How”)

  • Anatomical Origin: Begins with M-type retinal ganglion cells and projects to the magnocellular layers of the LGN, feeding directly into the dorsal visual stream (area V5/MT and posterior parietal cortex).
  • Functional Role: Responsible for low spatial frequency, motion detection, spatial orientation, optic flow, and peripheral awareness.
  • Temporal Characteristics: Ultra-fast transmission speed (30 – 50 ms delay); optimized for rapid spatial localization and subconscious interception.

What Drives Peripheral Vision Loss Under Stress?

When an athlete experiences intense physical exertion or acute competition stress, the Locus Coeruleus-Norepinephrine (LC-NE) system increases its tonic firing rate (Aston-Jones & Cohen, 2005). Moderate norepinephrine discharge enhances the signal-to-noise ratio in sensory processing. However, hyper-arousal and excessive norepinephrine release fundamentally alter cortical visual processing:

  1. Attentional Field Narrowing: High sympathetic tone triggers selective suppression of dorsal stream cortical areas. The central nervous system prioritizes central visual targets (foveal focus) to lock onto perceived primary threats, effectively dampening input from the peripheral visual fields (Easterbrook, 1959; Janelle, 2002).
  2. Superior Colliculus & Retinotectal Suppression: The superior colliculus, which coordinates rapid saccadic eye movements and peripheral target engagement, experiences altered top-down control from the prefrontal cortex (PFC). Subcortical survival networks take over, locking gaze onto central stimuli and increasing latency for peripheral visual acquisition.
  3. Cortical Receptive Field Shrinkage: Electrophysiological data demonstrates that under extreme autonomic arousal, visual cortical neurons servicing the far periphery (>30° visual angle) experience reduced receptive field sensitivity. The effective visual field shrinks from a normal 180° horizontal span to a narrow visual cone of 15° to 30°.
Scientific schematic comparing resting visual field breadth to stress-induced foveal tunnel vision and dorsal stream suppression.
Figure 2: Elevated catecholamine levels and high heart rates suppress the magnocellular (dorsal) pathway, collapsing broad spatial awareness into a narrow central foveal cone.

Lab Note: The Neuro-Visual Bottleneck

In-game “tunnel vision” is not an ocular muscle failure; it is a central nervous system compensation. Under severe metabolic strain (HR > 85% HR max), hyper-activity in the Locus Coeruleus suppresses magnocellular (dorsal stream) processing. This reduces functional peripheral awareness by up to 45% while preserving central foveal focus.

Field Diagnostics: Quantifying Visual Degradation Above 85% HR max

At our Neuro Performance Center in Surprise, AZ, we assess visual field degradation under physical stress across elite athletes from the NFL, NCAA, and tactical sectors.

During baseline assessments using digital visual testing systems (such as the Senaptec Sensory Station), elite athletes demonstrate high visual processing speed and peripheral target acquisition at resting heart rates (HR < 60 bpm). However, when subjected to progressive metabolic stress protocols (utilizing air bikes or high-velocity agility circuits to push heart rates above 85% HR max), their peripheral spatial processing metrics degrade significantly.

Diagnostic Observations (Surprise, AZ Center)

  • Peripheral Latency Degradation: Reaction speed to visual stimuli beyond 30° of visual eccentricity slows down by an average of 38% under high metabolic load.
  • Saccadic Overshoot (Hypermetria): Uncontrolled sympathetic arousal degrades ocular motor precision. Athletes exhibit frequent saccadic overshooting when attempting to re-fixate from central targets to peripheral cues.
  • Peripheral Omission Errors: Under max-effort fatigue, athletes completely miss up to 40% of transient peripheral targets presented in their outer visual fields (>45°).

[insert graphic: NEURO-VISUAL DECAY UNDER METABOLIC STRESS]

Technical infographic comparing neuro-visual metrics in a Resting State versus High Metabolic Stress. Data visualization shows significant degradation under high stress, including up to a 38% delay in peripheral reaction time, a shift to frequent saccadic overshoot, and a 40% peripheral target omission rate.
Figure 3: This quantitative analysis contrasts visual processing metrics—peripheral reaction time, saccadic precision, and target omission rates—between a calm baseline and acute high metabolic stress (>85% HRmax). These processing bottlenecks directly correlate to the in-game ‘tunnel vision’ that causes elite execution failure.


To eliminate this bottleneck, performance directors cannot rely on static vision exercises or off-field ocular tracking. Training protocols must force the visual cortex to maintain magnocellular stream integration while operating under elevated catecholamine levels and physical fatigue.

Operational Interventions

We utilize dynamic visual occlusion and gaze anchoring protocols under metabolic load to train these systems (Appelbaum & Erickson, 2018).

  1. Liquid Crystal Strobe Occlusion: Strobe eyewear alternates between transparent and opaque states at adjustable frequencies (e.g., 4 Hz down to 1 Hz). By reducing visual information to brief snapshots, strobe occlusion forces the brain to speed up visual processing, rely on internal predictive models, and maximize magnocellular motion detection.
  2. High Activation-Visual Coupling: Strobe eyewear training is applied while athletes perform high-intensity metabolic efforts (80%-90% HR max) and execute sport-specific spatial reads.
  3. Visual Anchor Fixation with Peripheral Extraction: Athletes maintain central gaze lock on a primary target (e.g., keying on a central defender) while simultaneously identifying, processing, and calling out peripheral targets flashed across their outer visual fields.

The Dynamic Occlusion Framework: Expanding Spatial Awareness Under Pressure

Preserving spatial processing under stress is essential for elite athletes, tactical personnel, and high-performing corporate executives. High-stakes decision-making in executive boardrooms triggers similar sympathetic arousal spikes, restricting cognitive bandwidth and narrowing environmental awareness.

The following three-phase protocol builds neural resilience against stress-induced visual field collapse.

Phase 1: Static Gaze Anchoring & Visual Field Expansion

Target Population: Athletes, Executives, Tactical Operators.

Objective: Establish top-down cortical control over peripheral visual field allocation without metabolic strain.

Execution:

  1. Sit or stand comfortably, fixating central gaze on a stationary target 2 meters away.
  2. Maintain strict visual fixation on the central point. Without moving eyes or head, consciously expand visual awareness outward to detect objects, movement, and boundaries at the far left, right, top, and bottom edges of the visual field.
  3. Hold this broad spatial awareness state while performing controlled, slow diaphragmatic breathing (4 second inhale, 6 second exhale) to keep sympathetic arousal low.
  • Volume: 30 sets x 60 seconds daily prior to performance or decision-heavy tasks.

Phase 2: Dynamic Visual Occlusion Under Metabolic Load

Target Population: High-Performance Athletes & Tactical Units.

Objective: Force dorsal visual stream processing during high autonomic arousal.

Execution:

  1. Equip liquid crystal strobe eyewear set to a moderate pulse rate (6 Hz).
  2. Initiate high-intensity cardiovascular work (assault bike, treadmill, or shuttle runs) until heart rate exceeds 80-85% HR max.
  3. While maintaining this target heart rate, execute reactive ball catches, target identification, or spatial decision drills using peripheral visual cues.
  • Volume: 5 sets x 45 seconds work intervals 15 seconds rest, 2-3 times per week.

Phase 3: Dual-Task Cognitive-Motor Peripheral Loading

Target Population: Return-to-Play Athletes & Executive Longevity Clients.

Objective: Integrate peripheral spatial awareness with dynamic motor execution and prefrontal cognitive processing.

Execution:

  1. Perform dynamic movement drills (e.g., reactive shuffling or multi-directional footwork).
  2. Maintain central visual tracking of an oncoming trainer or visual cue.
  3. Verbally identify light indicators or numbered targets flashed randomly in the peripheral visual field (45° to 60° angles) without breaking physical movement rhythm or dropping central visual focus.
  • Volume: 6 sets x 30 seconds with 45 seconds full recovery.

Key Takeaway: The Plasticity of Spatial Processing

Stress-induced tunnel vision is not a fixed physiological limit – it is a trainable visual processing capacity. By systematically pairing high heart rates with dynamic visual occlusion, the brain increases neural gain across the dorsal visual pathway, expanding functional spatial awareness during peak operational stress.

Optimize Your Team’s Visual Execution Under Pressure

Visual processing errors during late-game scenarios are not random mental lapses – they are trainable neuro-physiological bottlenecks. At the Neuro Performance Center in Surprise, AZ, we apply sensory diagnostic testing, strobe occlusion technology, and metabolic integration protocols to quantify and expand visual spatial awareness under peak operational stress.

Schedule an In-Center Assessment at our Neuro Performance Center to analyze your athletes’ visual processing under metabolic load and implement customized protocols to improve in-game performance.

References